

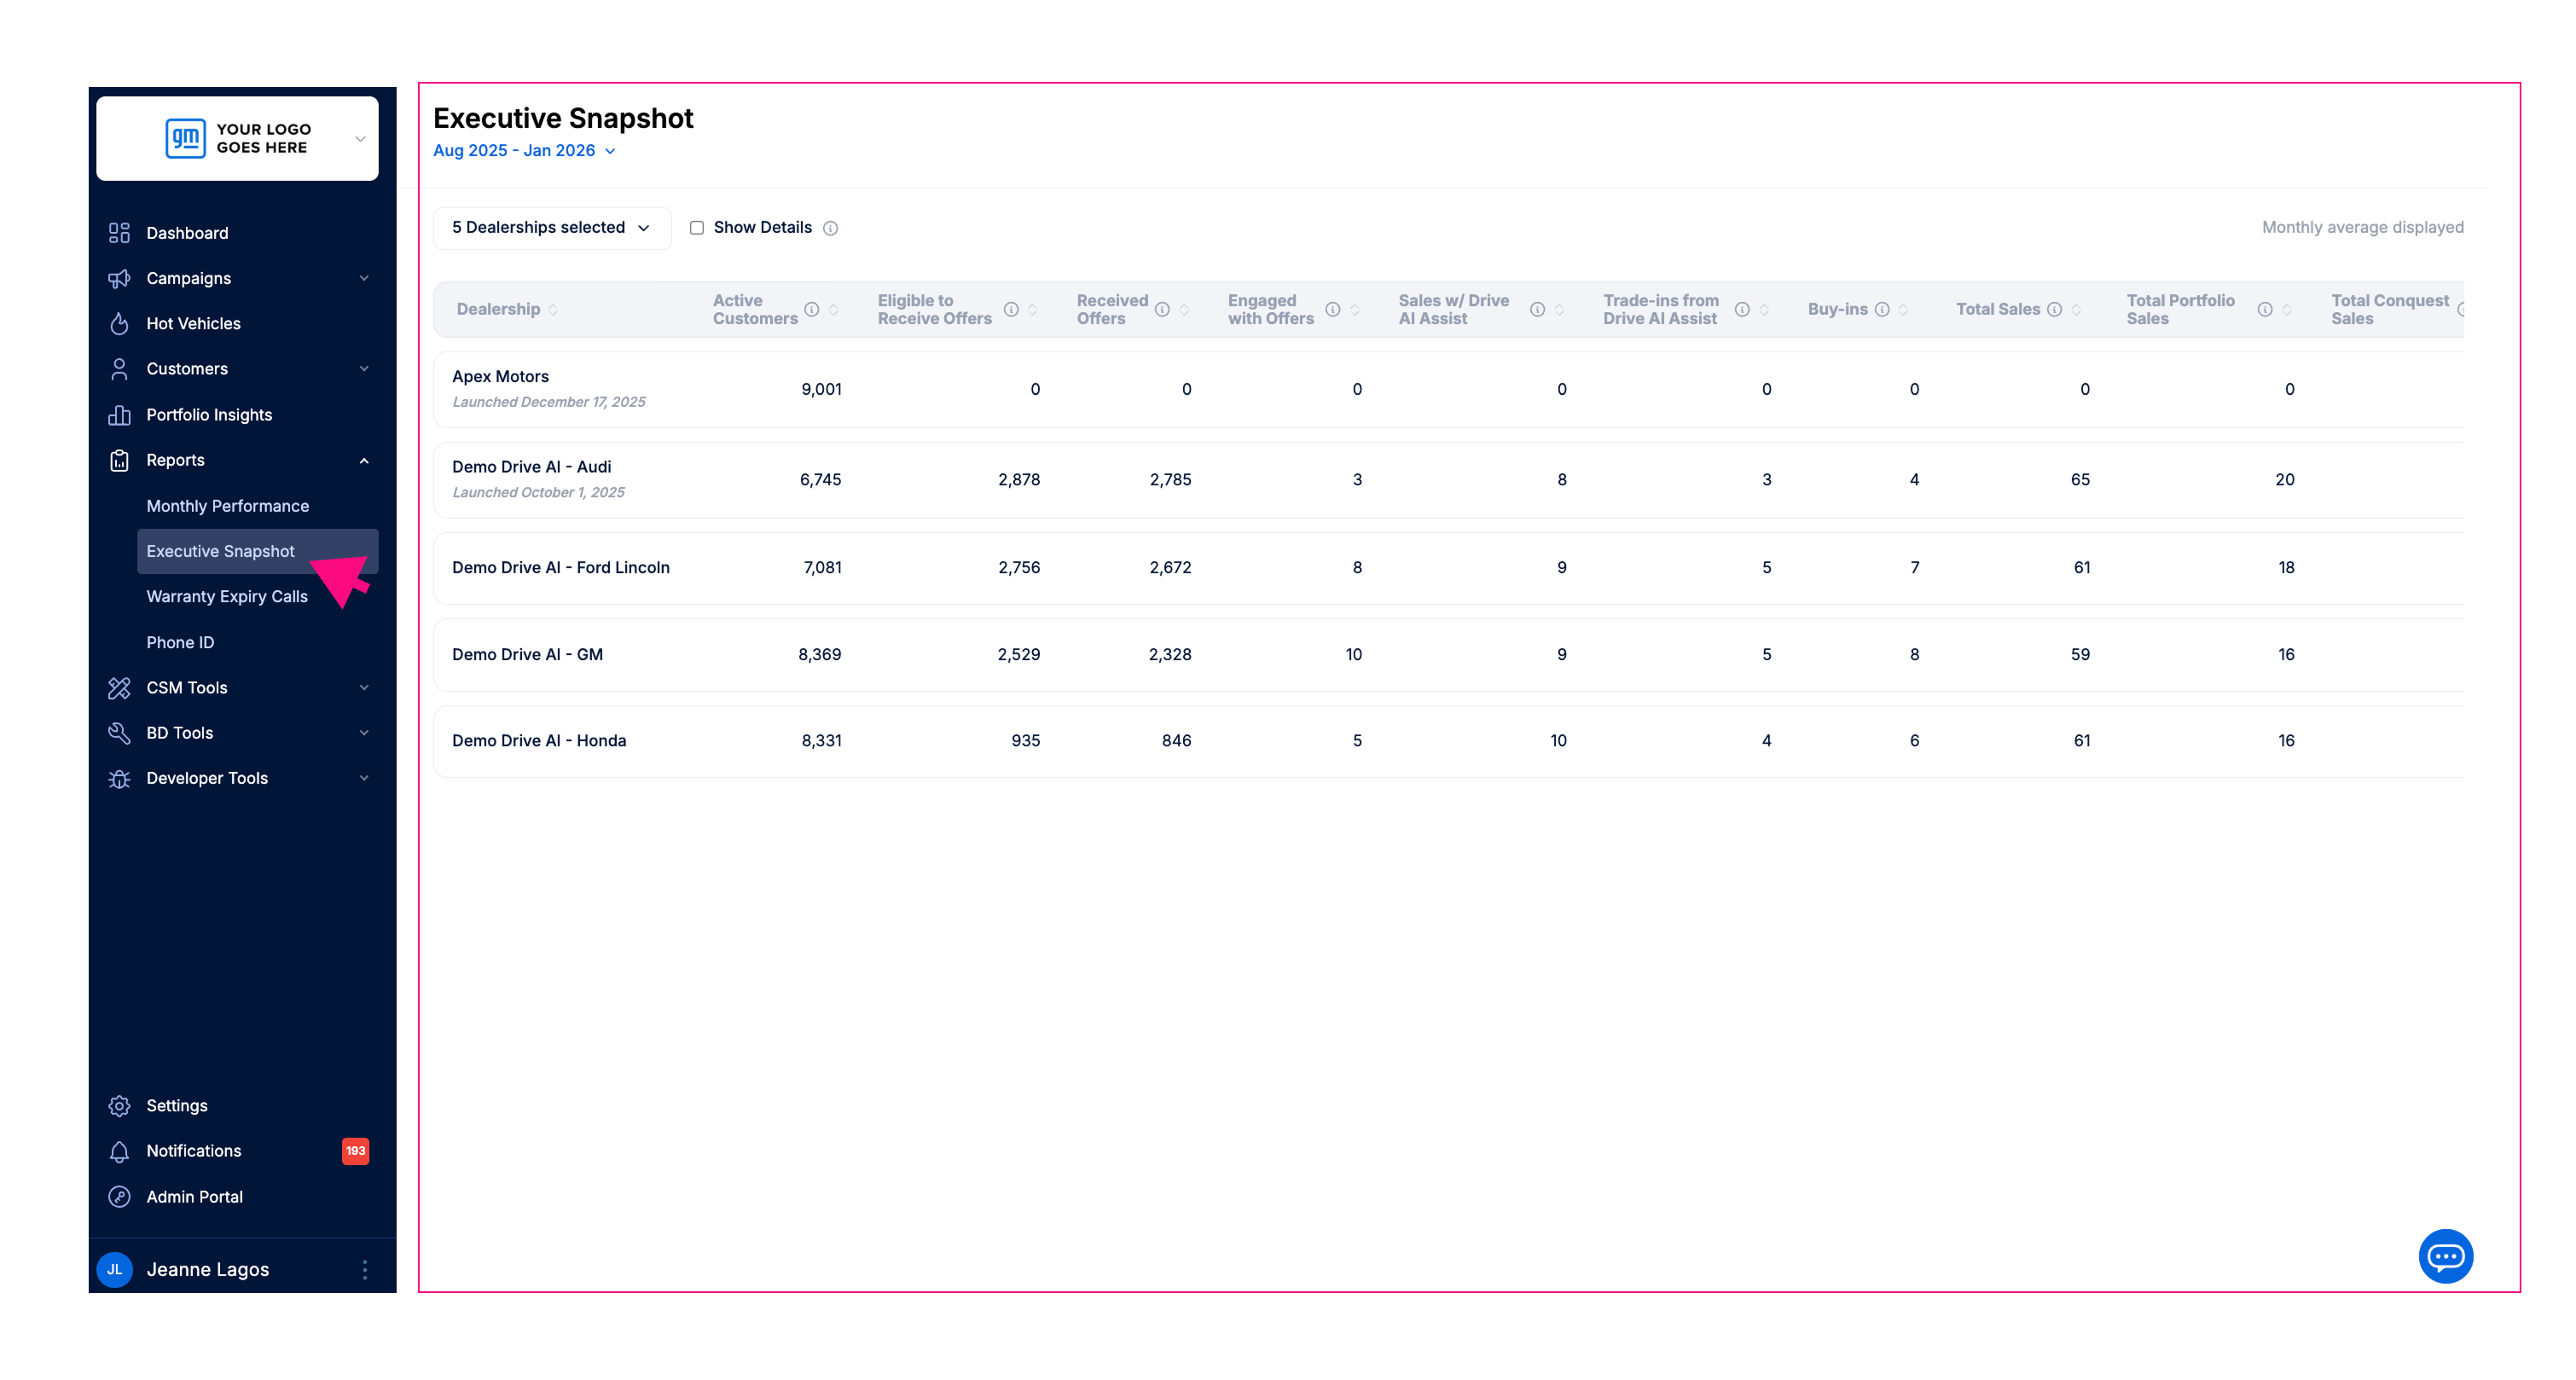
We’re introducing the Executive Snapshot, a new high-level report in Drive AI.
Whether you manage one store or multiple rooftops this overview allows you to quickly see the full performance story, from campaign activity through to customer engagement and sales impact, all in one place.
Flexible Date Selection with Monthly Averaging
Unlike the standard Monthly Performance report, you can select a custom month range (for example, Jan–Dec 2025). The system calculates the average monthly performance for each metric across the chosen date range.
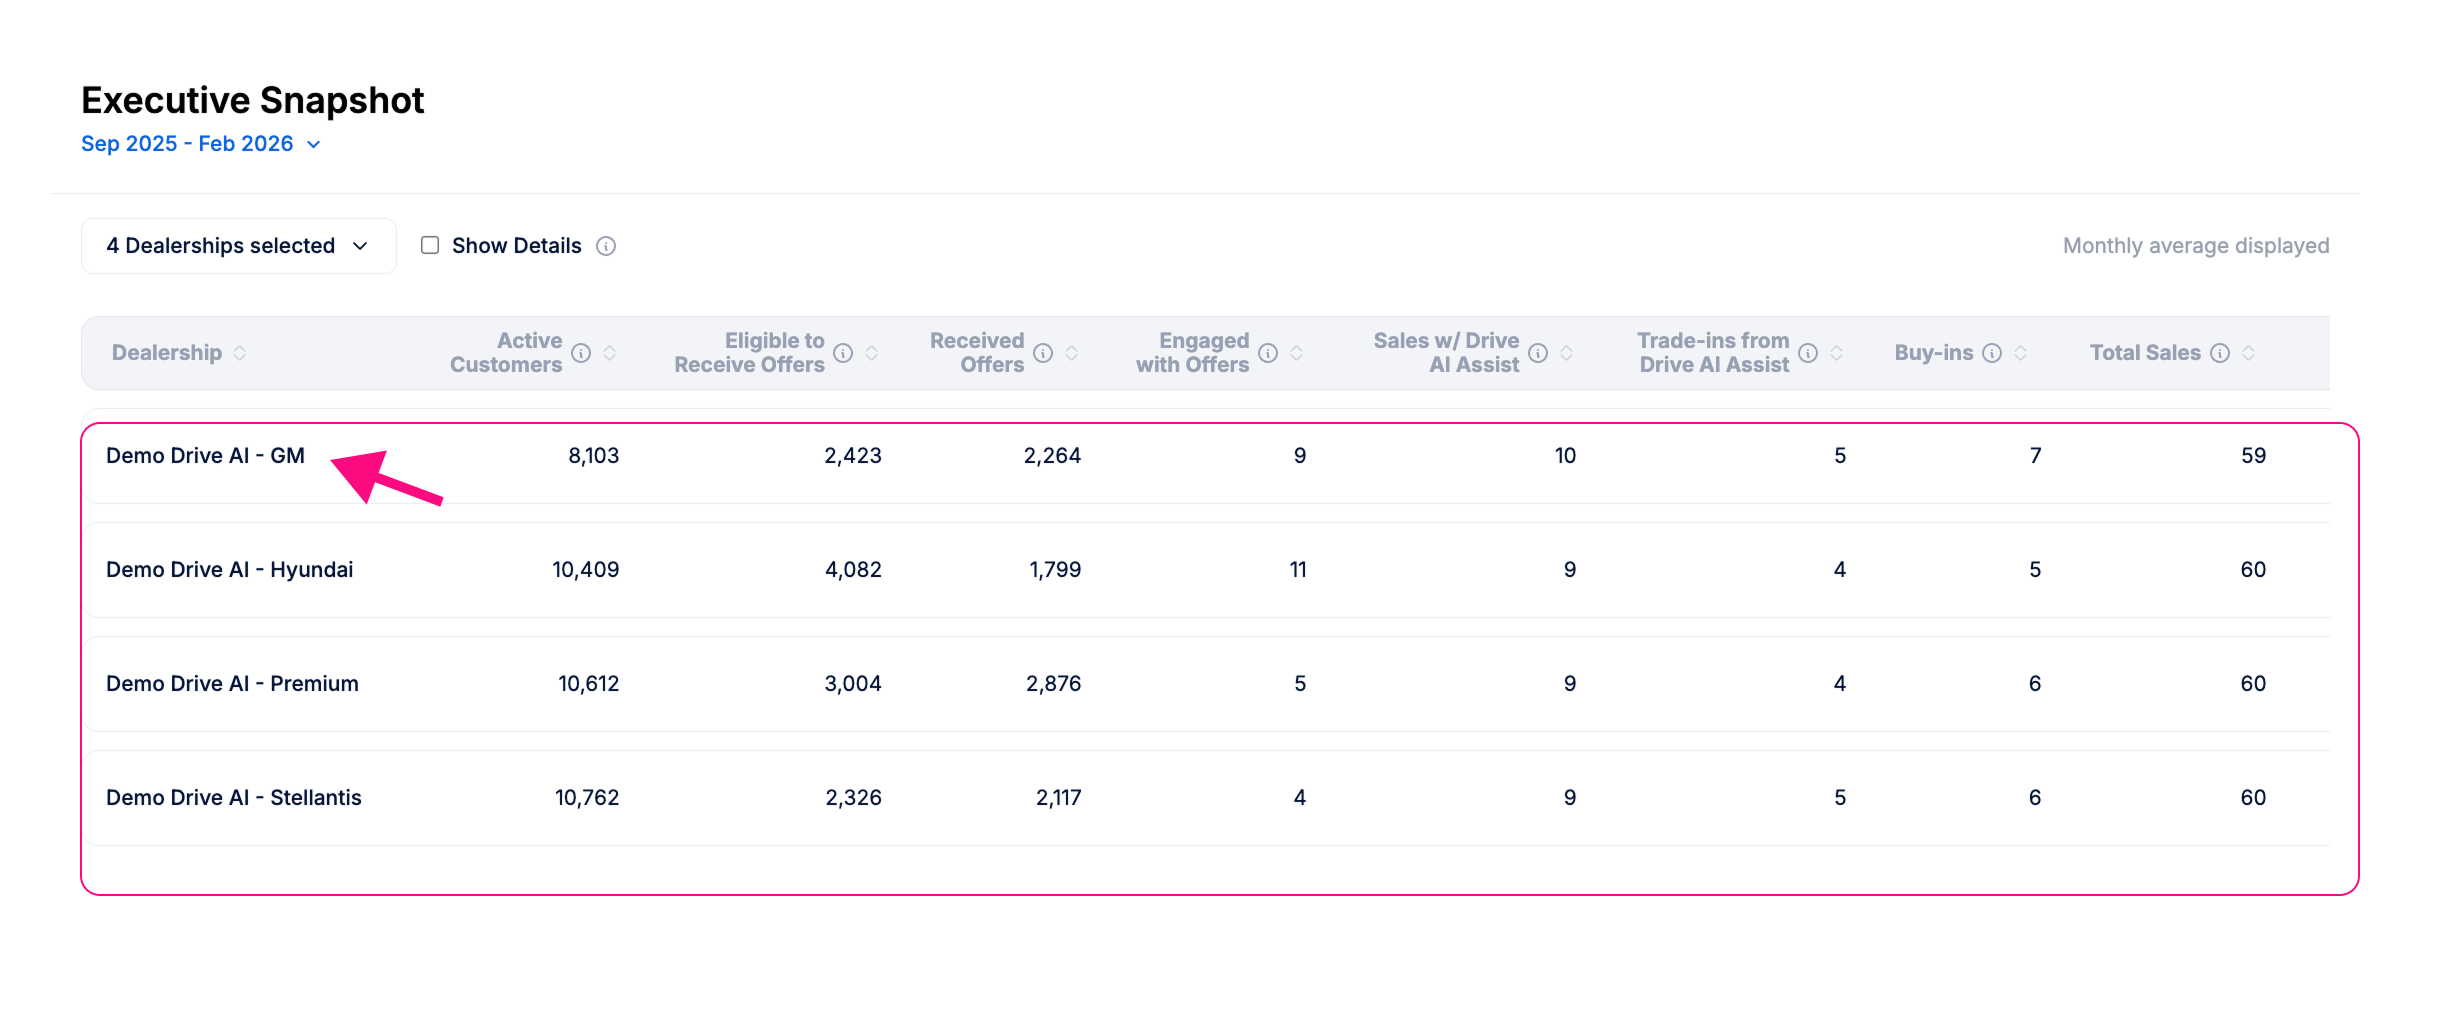
Multiple Rooftop Comparison
View performance across all stores using Drive AI that you manage in a clean, column-based grid. Each store appears in its own row, making it easy to compare results across rooftops. This quickly identifies which stores are leading or need attention.
📊 Performance Charts (New)
The Executive Snapshot now includes charts that show how your performance changes
month by month over a selected time period.
These charts help you quickly identify whether your key metrics are improving, declining, or remaining consistent over time.
Who is this report for?
The Executive Snapshot is available to all Drive AI users.
It is especially valuable for users with multi-dealership access, including:
Dealer Group Admins
Multi-store operators
Other authorized users with access to 2 or more dealerships.
What dealerships will I see?
Your view is based on your existing Drive AI permissions.
When you open the Dealership Selector:
You will only see dealerships you are authorized to view
You can multi-select from that approved list
Show Details
To keep the report easy to scan, some secondary metrics are hidden.
By default:
The Show Details checkbox is unchecked
Percentage columns and additional metrics are hidden
Primary performance metrics remain visible without extra scrolling
If you need deeper analysis:
Check Show Details
Additional columns, including percentage metrics, will appear
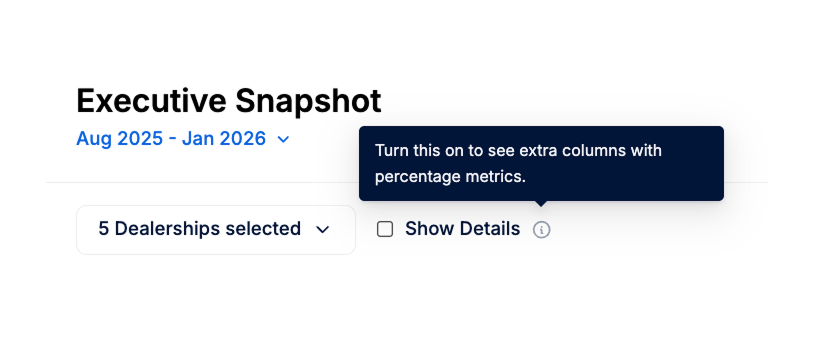
An information icon next to Show Details explains that enabling this option reveals extra columns.
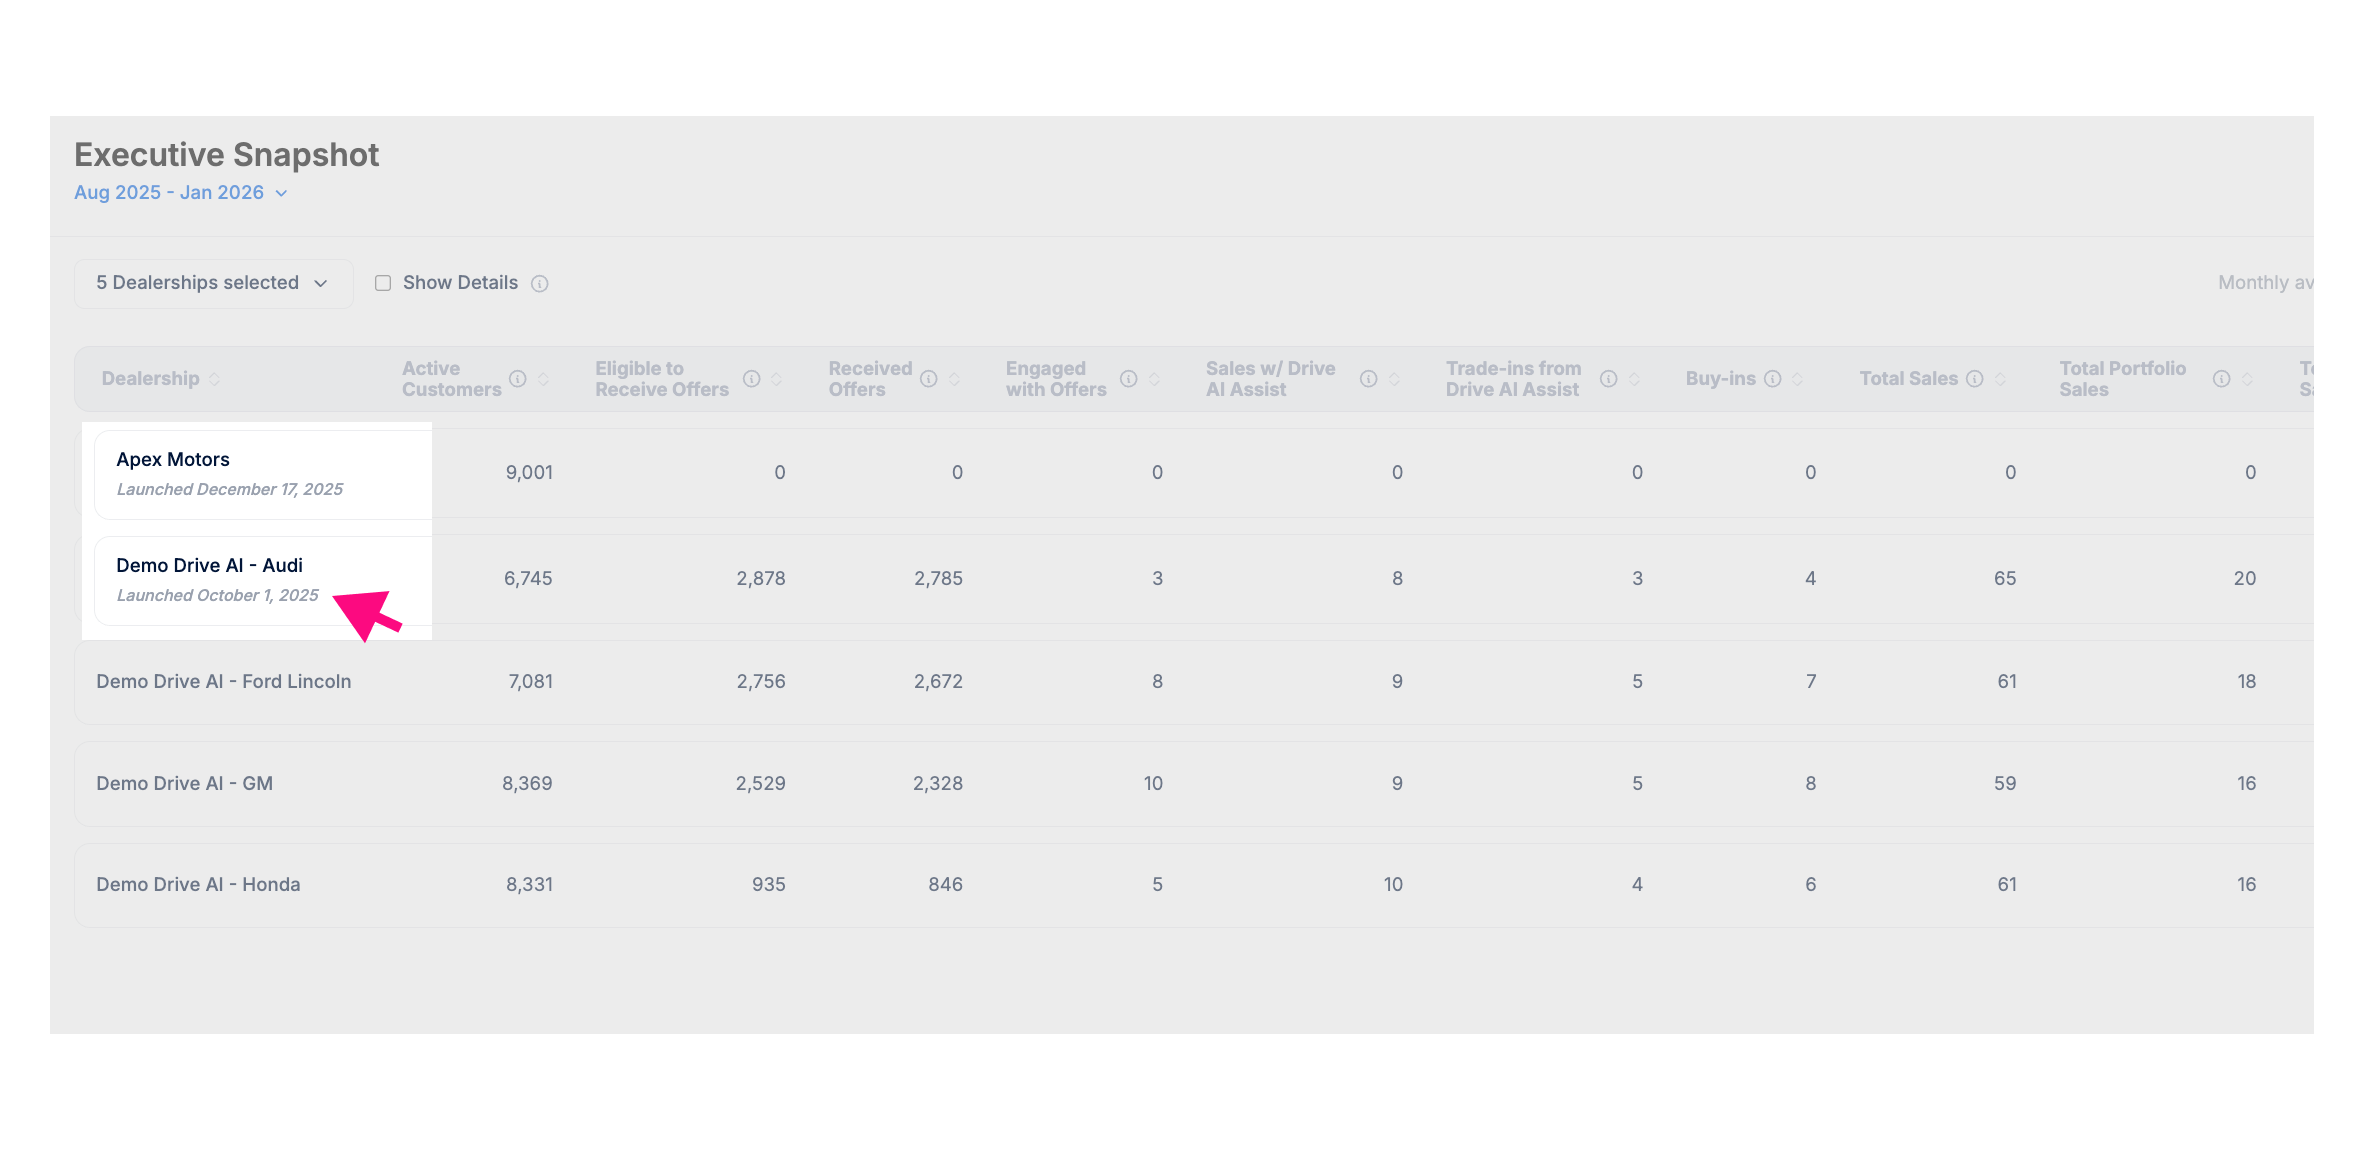
Launch date labels
If a selected dealership does not have data for the full date range you selected, the Executive Snapshot will display a Launch Date label for that store, and its displayed data will only include the full months that dealership has been on Drive AI within the selected date range.
This helps explain why data may appear limited or why averages may differ between stores.
Viewing Charts 📊
How charts are displayed depends on your access:Single-store access
If you only have access to one store (or your group has one store), a line chart will automatically appear below the table.
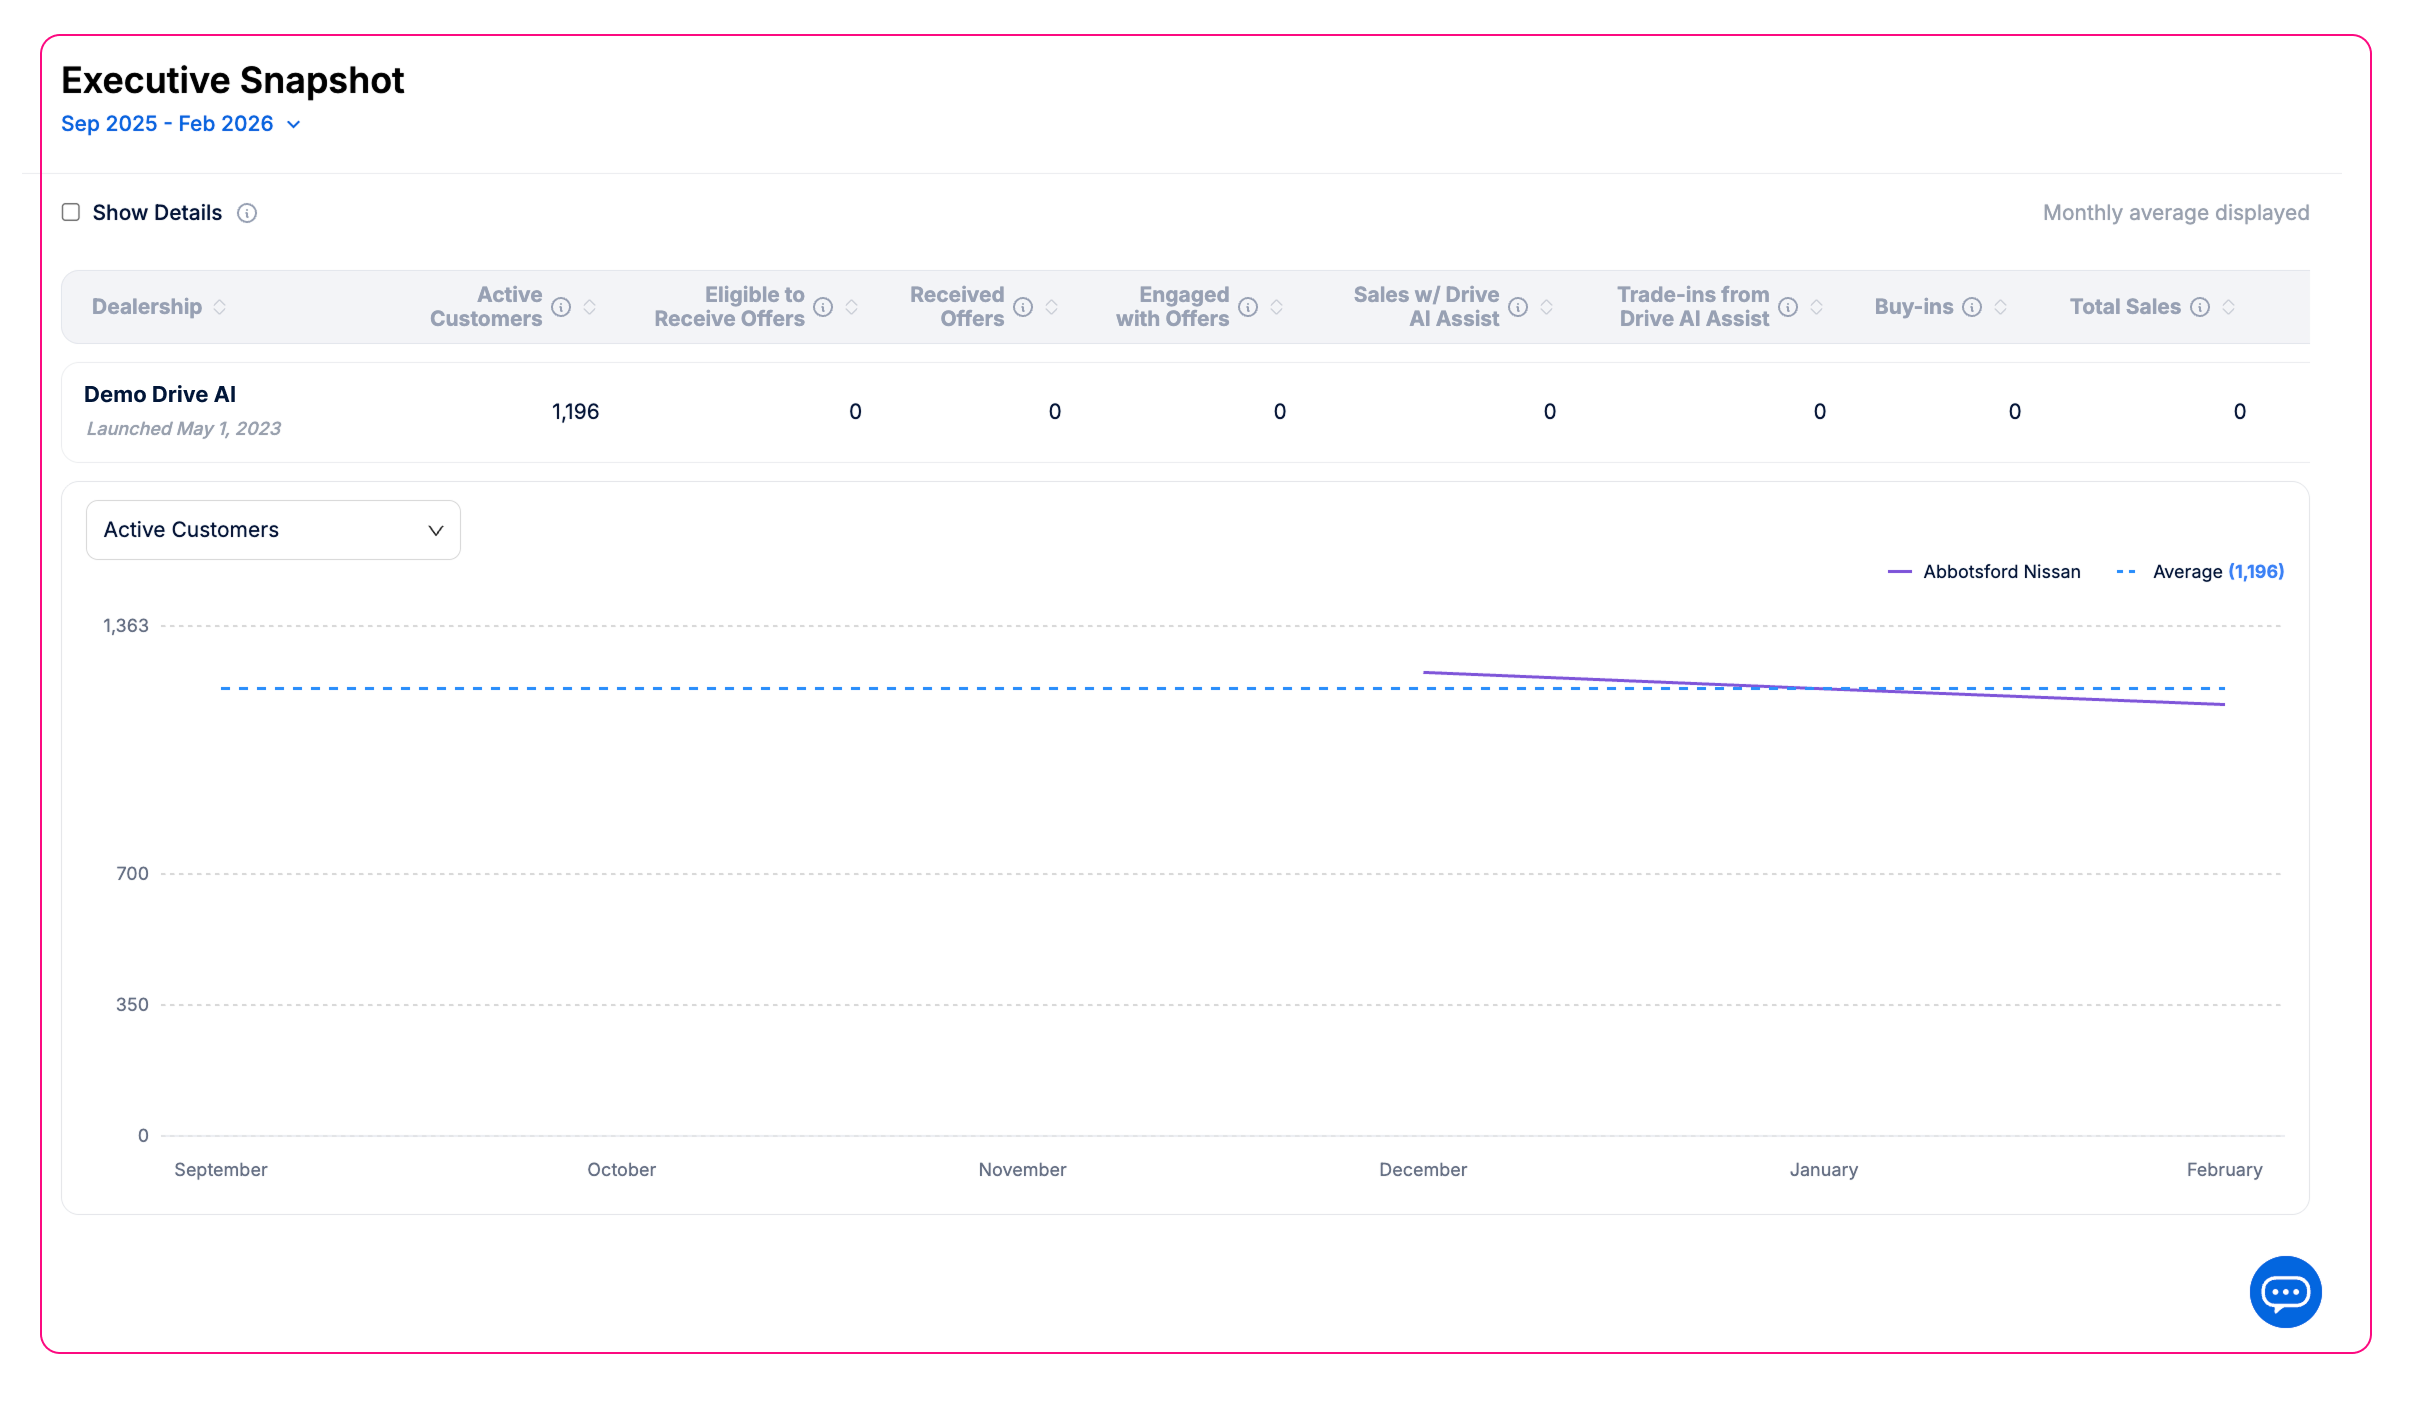
Multi-store access
If you have access to multiple stores, the report will default to table view. To view a chart, click on a store’s row to open its chart.
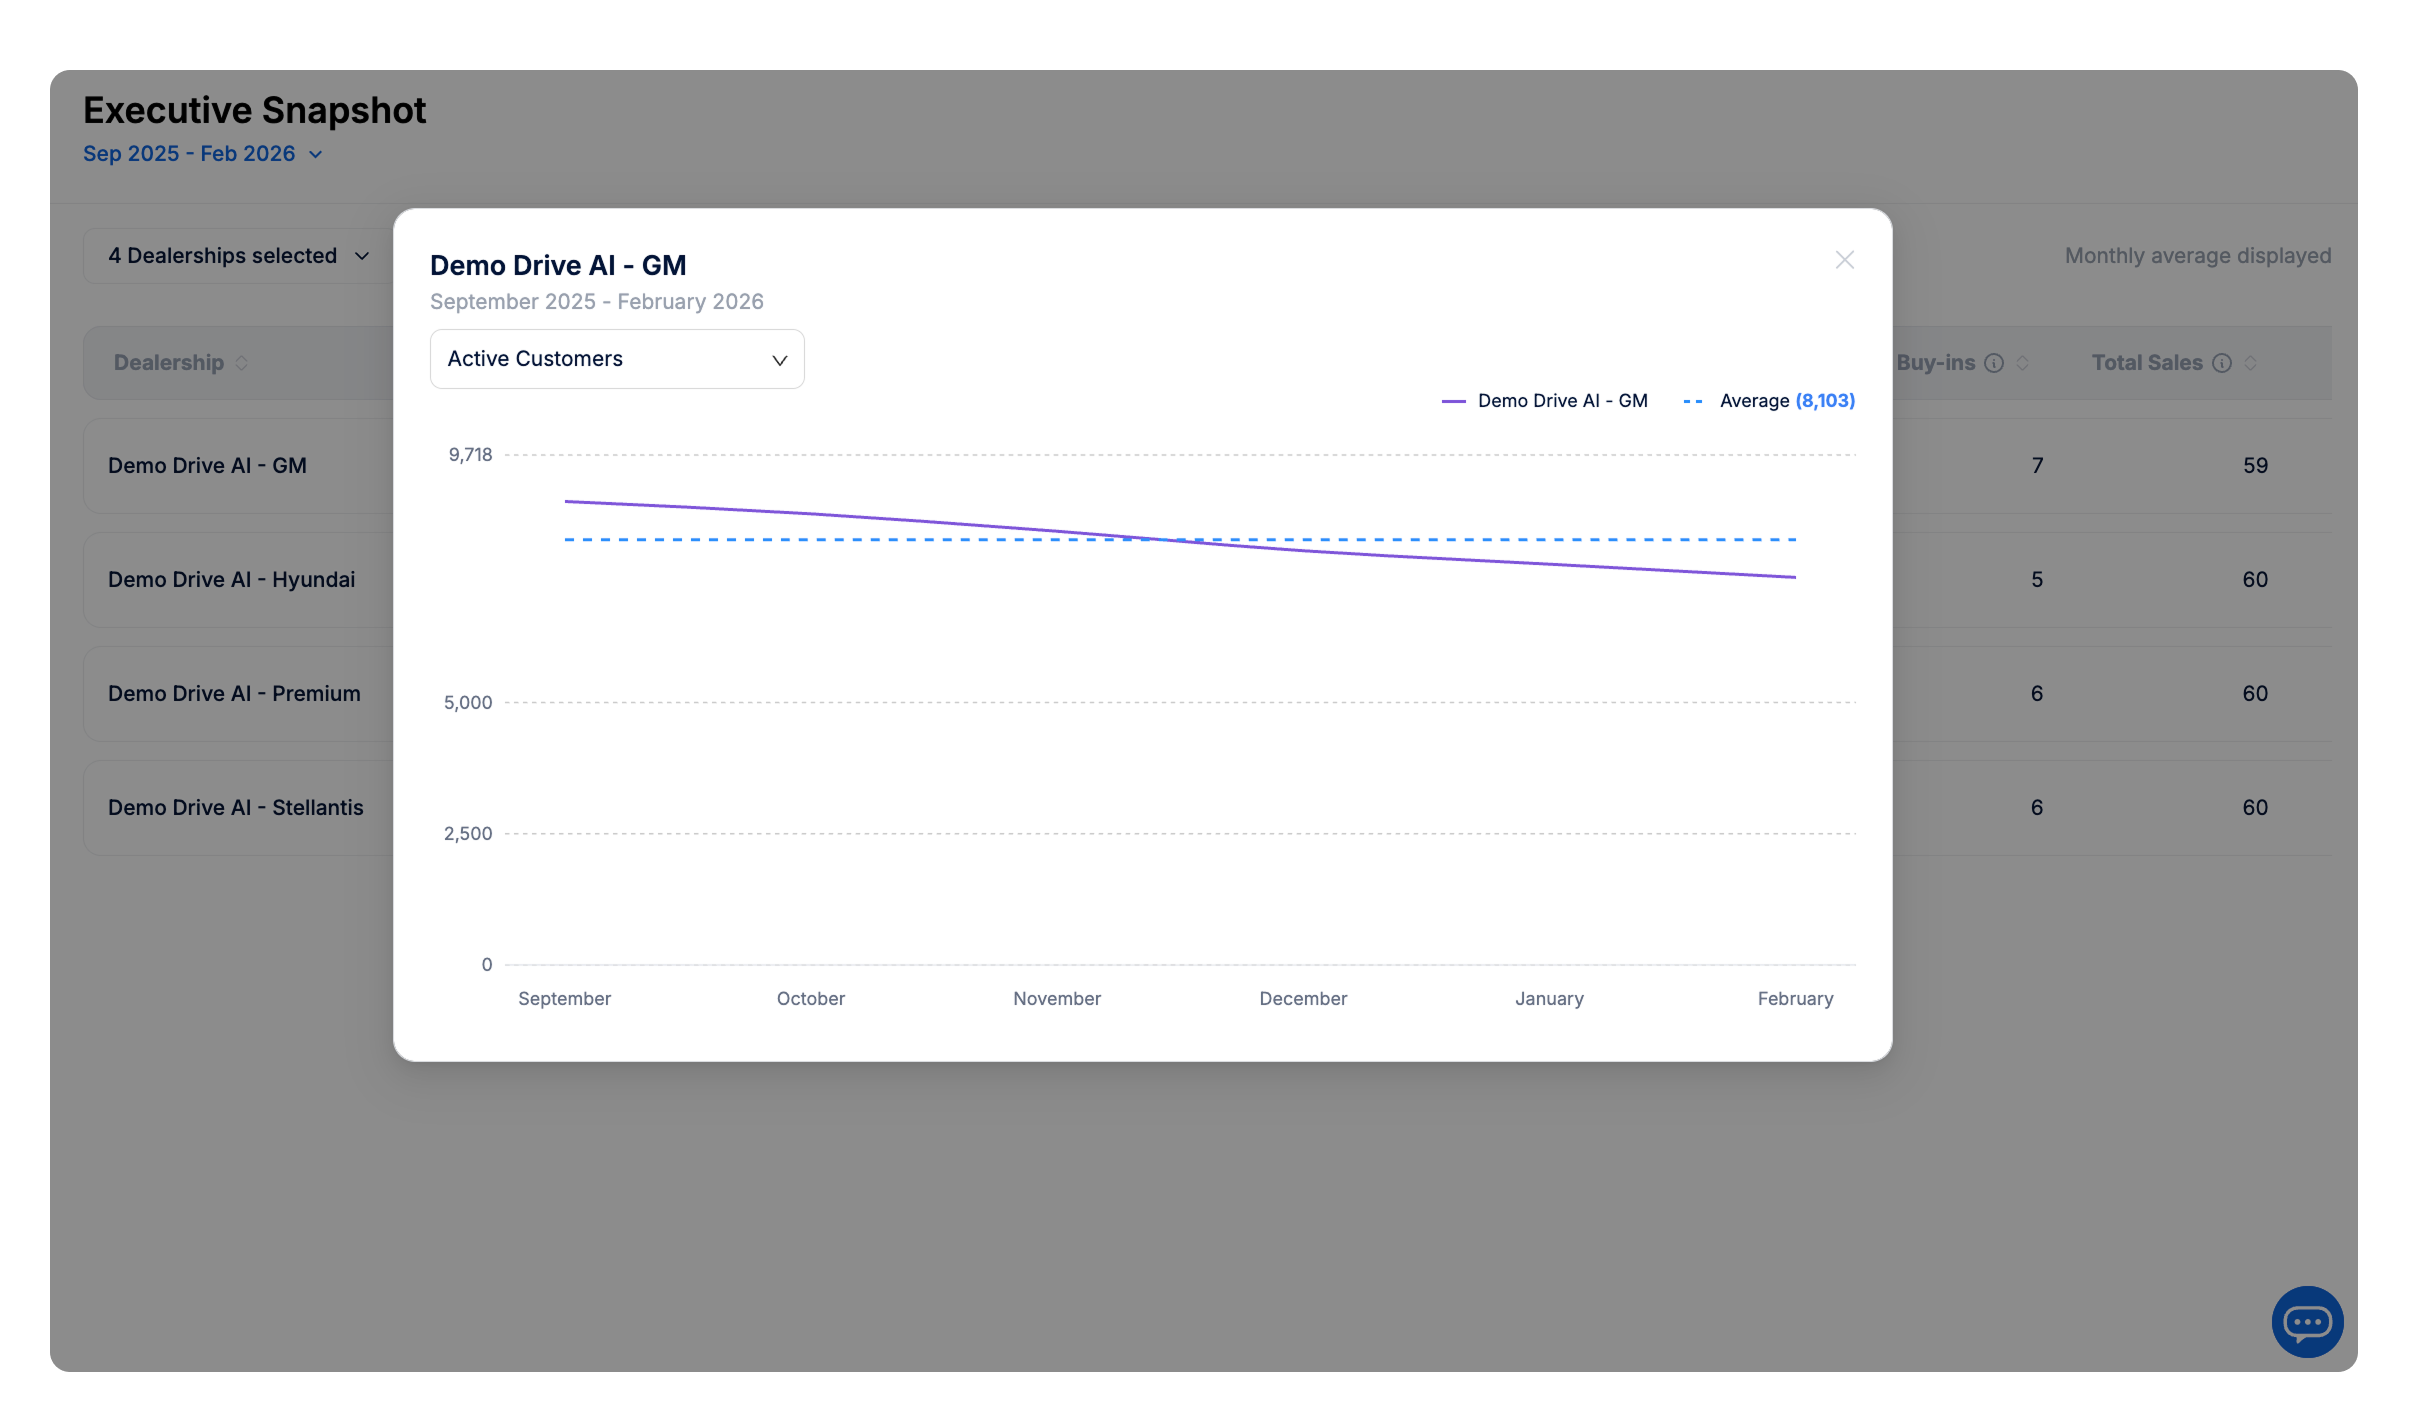
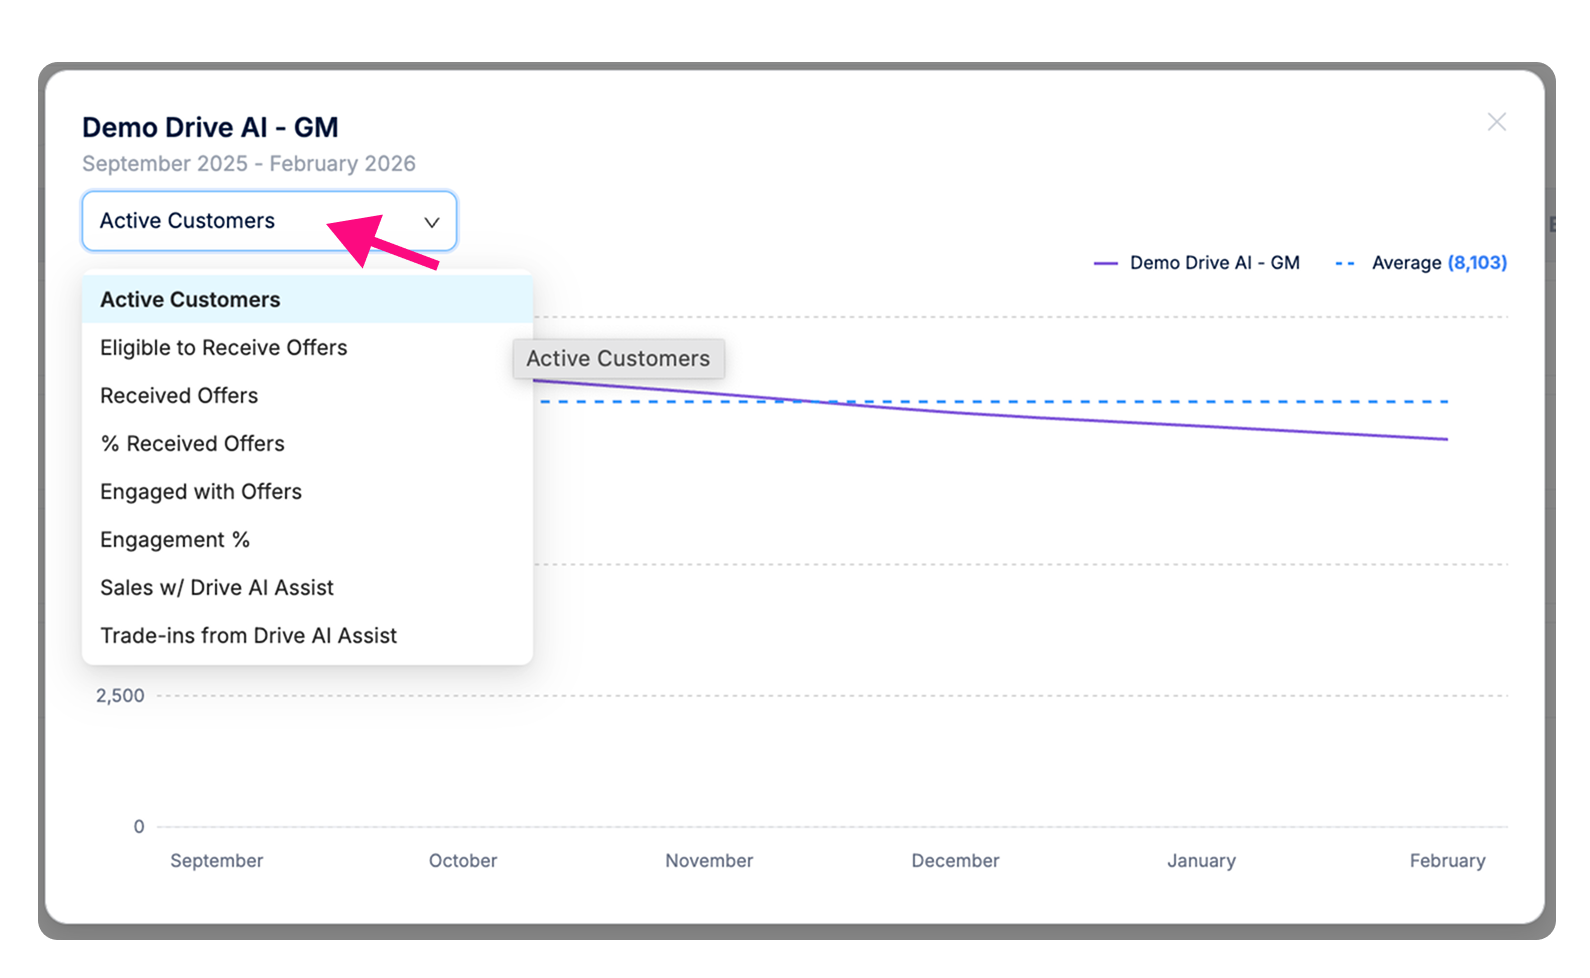
Switching metrics
Within the chart view, use the dropdown menu to switch between different metrics (e.g., Active Customers, Engagement %).
How is this different from the Monthly Performance Report?
The Executive Snapshot does not replace the existing Monthly Performance Report. Each serves a different purpose.
The Monthly Performance Report (Standard): This is your visual deep dive for a single store and a single month. It uses graphs and charts to show granular details like email delivery rates, specific service drive activity, and sales mix.
The Executive Snapshot: This is your high-level overview. It uses a table view to show consolidated data and monthly averages across one or many dealerships, highlighting your portfolio’s addressable market and customer engagement.
Glossary: Understanding the Report Metrics
Use this guide to understand exactly what each metric in your Executive Dashboard represents.
Active Customers: Any customer who has purchased a vehicle in the last 5 years or serviced in the past 2 years.
Eligible to Receive Offers: The total number of customers who qualified for outreach based on dealership rules. This includes:
Customers with offers meeting predefined parameters for automatic delivery via email or SMS.
Customers with qualifying offers who have an upcoming service appointment.
Any customer who was manually sent an offer by a dealership user.
Received Offers: Customers who had an offer successfully delivered in any format.
% Received Offers: The percentage of eligible customers who successfully received their offer.
Engaged with Offers: Customers who took action, such as an SMS reply, link click, test drive/appraisal request, or QR code scan.
Engagement %: The percentage of customers who received an offer and then engaged with it.
Sales with Drive AI Assist: Transactions where the customer received an offer within 120 days prior to the sale being completed.
Trade-Ins from Drive AI Assist: A sales transaction in which a customer traded in their vehicle for another vehicle, provided they received a Drive AI offer before the transaction was completed.
Buy-Ins: Transactions where a customer sold their vehicle to the dealership after receiving an offer.
Total Sales: Total Retail Sales.
Total Portfolio Sales: Total sales made to past customers (Sales Renewals or Service Conversions).
Total Conquest Sales: Sales to brand-new customers who have never serviced or purchased there before.
% Sales w/ Drive AI Assist (Portfolio): The percentage of sales to past customers that were assisted by Drive AI.
% Sales w/ Drive AI Assist (All Sales): The percentage of all dealership transactions assisted by Drive AI.